If you’re responsible for marketing or running a website, keeping track of how well you’re performing in search can feel overwhelming.
Multiple tools, separate platforms and dozens of different reports make it hard to get a quick, meaningful snapshot of what’s working and what isn’t.
Even as AI tools increasingly summarise answers for users, they still rely heavily on search engines to find and rank the content they cite. If you want your site to be found by both people and AI, investing in search visibility, and being able to track it simply, remains essential.
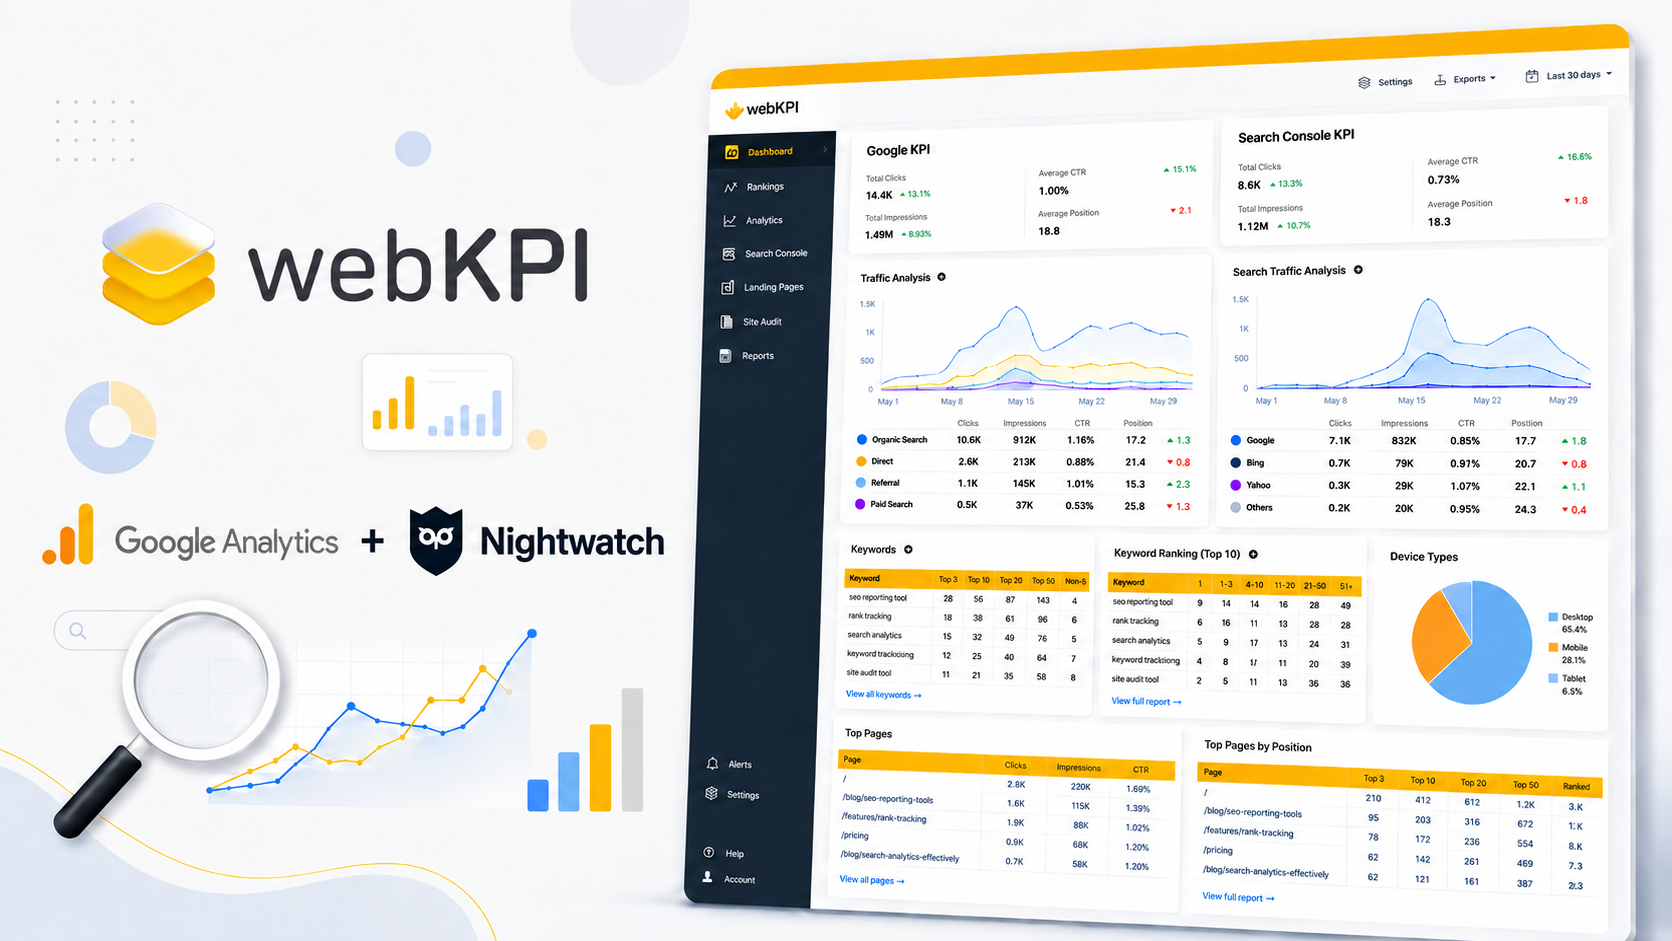
One of the simplest ways to get that clear view is with a focused dashboard like webKPI, which pulls key highlights from Google Analytics and keyword-rank tracking (Nightwatch) into one place.
The problem: too many clicks, not enough clarity
Google Analytics is free and powerful, but finding the answers to day-to-day questions often means:
- Logging in, navigating multiple menus, and changing date ranges.
- Cross-checking traffic sources, landing pages, and device data across different reports.
- Then opening a separate rank tracker to see how your keywords are moving.
For busy marketers and small teams, that “many-click” workflow makes it easy to delay checking performance, makes it difficult to spot trends or to miss important changes.
A simpler approach: one dashboard for search and site performance
webKPI is built around the idea that you should be able to answer your core performance questions in one place. It combines:
- Selected Google Analytics highlights (traffic, sources, behaviour).
- Leading keyword tracking figures from Nightwatch (rankings, visibility trends).
The result is a single dashboard focused on the metrics that matter most for SEO and content performance.
The key questions webKPI helps you answer
Using a tool like webKPI, you can quickly get a clear view of:
- Is my traffic overall moving in the right direction?
See total sessions and trends over time without digging through GA4’s exploration reports. - Are my social channels driving traffic?
Check traffic by source/medium to understand which social platforms are actually sending visitors. - Do I have a bounce or engagement problem?
Review bounce rate / engagement metrics to spot pages where visitors leave quickly. - Is Google indexing and ranking my site?
Track Pages Indexed and Keyword ranking visibility to confirm your pages are appearing in search results for target terms. - Which pages are getting the most traffic?
Identify top landing pages and content that’s resonating with your audience. - Are my customers using mobiles or desktops?
See device breakdowns so you can prioritise mobile UX or desktop-focused content as needed.
These aren’t the only metrics you’ll ever need, but they’re the ones you’ll return to again and again when assessing SEO, content, and campaign performance.
How agencies and customers use webKPI in practice
In real-world use, webKPI tends to fit into two main workflows:
Marketing agencies use it to:
- Support client reporting with clear, digestible snapshots.
- Show the impact of SEO and content work without overwhelming clients with raw GA4 data.
- Keep internal teams aligned on what’s moving (rankings, traffic, top pages)
Business owners and in-house marketers use it to:
- Assess whether their social and SEO efforts are translating into traffic.
- Quickly sanity-check performance before deeper analysis.
- Monitor progress on key campaigns or new content without becoming analytics experts.
The value is less about replacing full analytics platforms and more about making the essential data immediately visible and actionable.
How this fits into a broader SEO and content strategy
Top-ranking SEO guides stress that good tracking is part of a cycle:
- Choose the right keywords based on search intent and competition.
- Track rankings and traffic to see what’s working.
- Create and optimise content around those terms.
- Refresh and refine your keyword list and content on a regular basis.
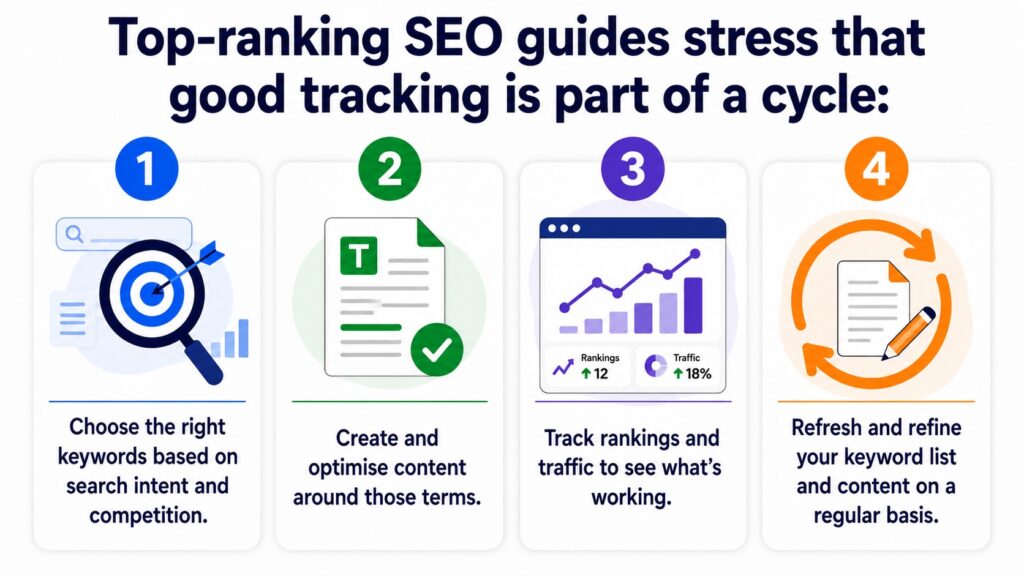
A dashboard like webKPI slots neatly into steps 3 and 4, giving you a fast feedback loop so you can iterate quickly.
If you’d like to see how a focused, one-dashboard approach could work for your site, you can request a free trial of webKPI by contacting: [email protected]
They can set you up with access and talk through how to configure it for your specific goals, whether that’s improving organic visibility, proving the value of social campaigns, or simply getting a clearer picture of your site’s performance.
Get in touch with the matm team today.
Frequently asked questions about WebKPI
What is webKPI?
webKPI is a website performance dashboard that brings selected Google Analytics data and Nightwatch keyword-ranking information into one place. It helps businesses, marketers and agencies monitor website traffic, search visibility and content performance more easily.
What website performance data can webKPI track?
webKPI can display key metrics such as website sessions, traffic sources, engagement or bounce rates, top landing pages, device usage, indexed pages, keyword rankings and search visibility trends.
Can webKPI track keyword rankings and website traffic together?
Yes. webKPI combines keyword-ranking data from Nightwatch with selected Google Analytics metrics. This makes it easier to see whether improvements in search rankings are also contributing to increased website traffic.
Does webKPI replace Google Analytics and Nightwatch?
No. webKPI does not replace Google Analytics or Nightwatch. It presents selected information from both platforms in a simpler dashboard, while the original tools remain available for more detailed analysis.
How can webKPI help improve SEO performance?
webKPI makes it easier to identify ranking changes, traffic trends and high-performing pages. These insights can help you decide which content to update, which keywords to prioritise and where further SEO work may be needed.